Pearson vs. Spearman Correlation: Differences and Examples
Pearson vs. Spearman Correlation: Differences and Examples
When analyzing research data, one common question is whether two variables are related. For example, does an increase in study time correspond to higher examination scores? Is there a relationship between fertilizer concentration and plant growth? Do pesticide concentrations increase as insect mortality rises?
Correlation analysis helps researchers answer these questions by measuring the direction and strength of an association between two variables.
Two widely used statistical methods for this purpose are Pearson correlation and Spearman rank correlation. Although both produce a correlation coefficient, they are based on different principles and are suitable for different types of relationships.
Choosing the wrong method can lead to misleading conclusions, particularly when your data contain outliers, are ordinal, or follow a nonlinear pattern.
In this guide, we will explain Pearson vs. Spearman correlation in simple language, explore their formulas, work through practical examples, and show you how to choose the appropriate method for your research.
What Is Pearson Correlation?
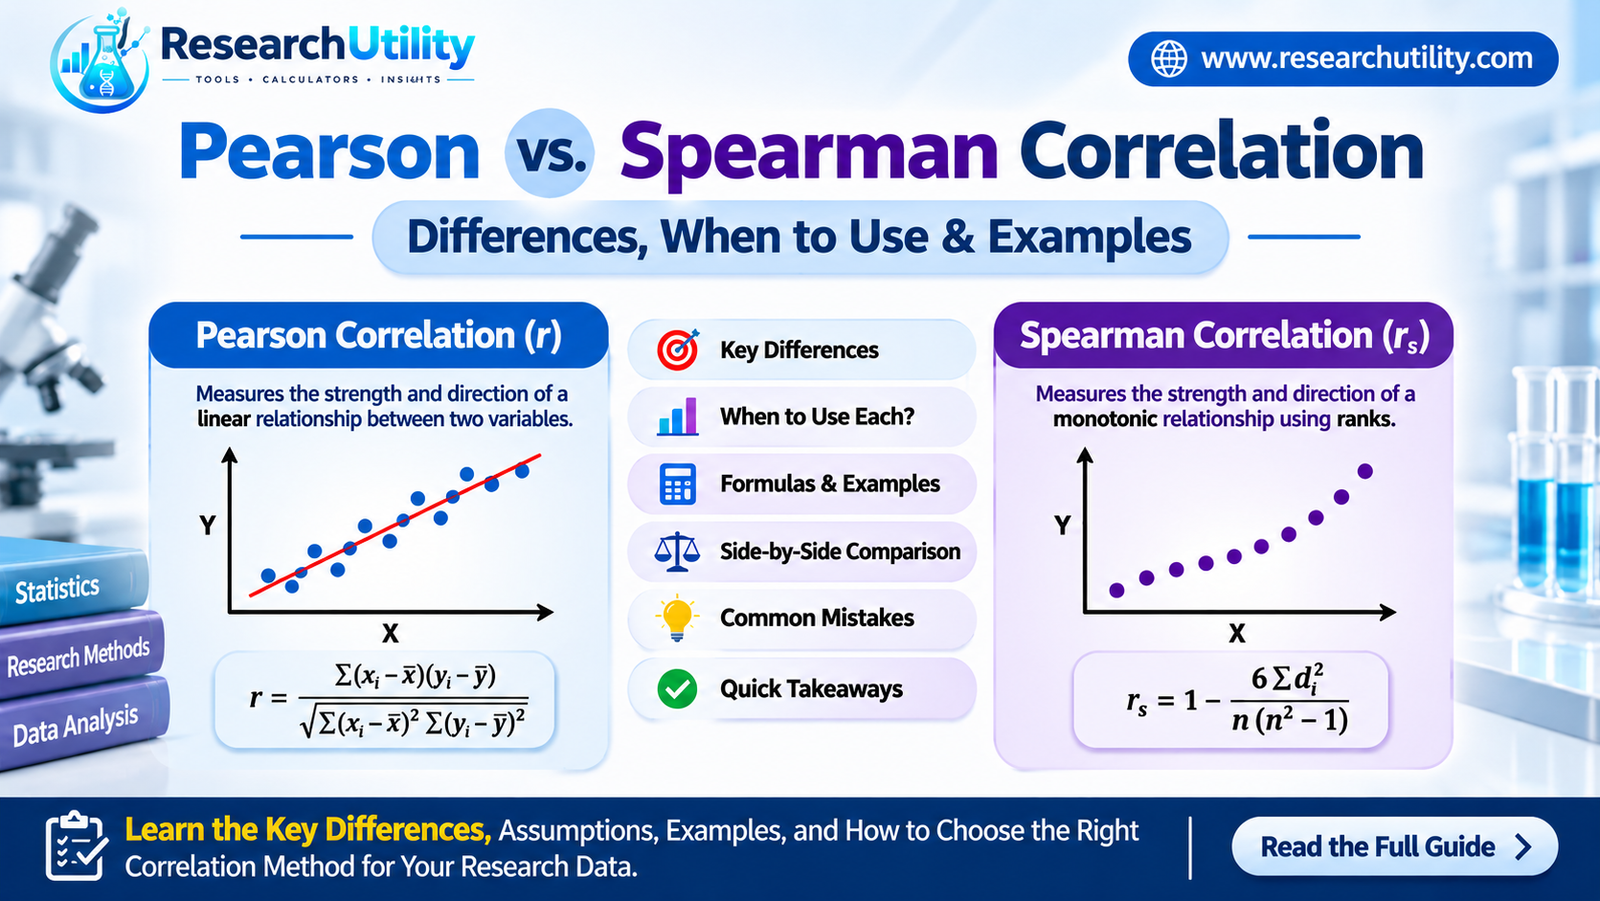
Pearson correlation, also known as the Pearson product-moment correlation coefficient, measures the strength and direction of a linear relationship between two numerical variables.
It is commonly used in biology, chemistry, psychology, education, agriculture, and other research fields.
For example, a researcher might investigate whether increasing the concentration of a chemical solution is associated with an increase or decrease in a measured response.
Pearson correlation describes how closely the observed data follow a straight-line relationship. It does not establish that one variable causes changes in the other.
Pearson Correlation Coefficient Formula
The Pearson correlation coefficient is represented by the symbol r.
[
r=\frac{\sum (x_i-\bar{x})(y_i-\bar{y})}
{\sqrt{\sum(x_i-\bar{x})^2\sum(y_i-\bar{y})^2}}
]
Where:
- (x_i) represents an individual observation of variable X.
- (y_i) represents the corresponding observation of variable Y.
- (\bar{x}) represents the mean of variable X.
- (\bar{y}) represents the mean of variable Y.
- (\sum) indicates the sum across all paired observations.
The coefficient ranges from −1 to +1.
- +1: Perfect positive linear correlation.
- 0: No linear correlation.
- −1: Perfect negative linear correlation.
A coefficient close to zero does not necessarily mean that the variables are unrelated. They may have a strong nonlinear relationship that Pearson correlation does not adequately describe.
When Should You Use Pearson Correlation?
Pearson correlation is generally appropriate when:
- Both variables are quantitative and measured on a meaningful numerical scale.
- The relationship is approximately linear.
- Observations are independent, subject to the study design.
- There are no influential outliers that substantially distort the relationship.
- For conventional significance testing and confidence intervals, the relevant distributional assumptions are reasonably satisfied.
For example, Pearson correlation may be suitable for examining the relationship between plant height and biomass when both are measured numerically and their relationship is approximately linear.
What Is Spearman Correlation?
Spearman rank correlation, also called Spearman’s rank-order correlation, measures the strength and direction of a monotonic relationship between two variables.
A monotonic relationship means that as one variable increases, the other tends to increase or decrease consistently. The relationship does not have to follow a straight line.
Unlike Pearson correlation, Spearman correlation works with the ranks of observations rather than their original numerical values.
This makes it particularly useful for ordinal data, ranked observations, and certain datasets in which extreme values or nonlinear relationships make Pearson correlation less appropriate.
Spearman Correlation Formula
Spearman’s rank correlation coefficient is represented by the symbol (\rho) (rho) or (r_s).
When there are no tied ranks, it can be calculated using:
[
r_s=1-\frac{6\sum d_i^2}{n(n^2-1)}
]
Where:
- (d_i) is the difference between the ranks of the paired observations.
- (n) is the number of paired observations.
- (\sum d_i^2) is the sum of the squared rank differences.
Important: This simplified formula assumes there are no tied ranks. When observations share the same value, they generally receive average ranks, and Spearman correlation should be calculated as the Pearson correlation of the ranked variables.
When Should You Use Spearman Correlation?
Spearman correlation is often appropriate when:
- Your variables are ordinal, such as satisfaction ratings or severity categories.
- Your relationship is monotonic but not necessarily linear.
- Your observations can be meaningfully ranked.
- Extreme values make rank-based analysis more suitable than analysis of the original values.
- The relationship between variables is consistently increasing or decreasing but follows a curved pattern.
For example, a researcher might examine the association between pesticide dose and a ranked measure of biological response when the response increases consistently but not at a constant rate.
Spearman correlation is not automatically the best choice whenever data are non-normal. The structure of the relationship, measurement scale, study design, and research question should guide the decision.
Try it yourself: Use the Spearman Rank Correlation Calculator on ResearchUtility to enter paired observations, calculate Spearman’s rho, inspect average ranks for tied values, review the significance test and bootstrap confidence interval, and export the calculation table.
Pearson vs. Spearman Correlation: Key Differences
The main difference between Pearson and Spearman correlation is what they measure: Pearson focuses on linear association, whereas Spearman focuses on monotonic association.
| Feature | Pearson correlation | Spearman correlation |
|---|---|---|
| Main purpose | Measures linear association | Measures monotonic association |
| Data used | Original numerical values | Ranks of observations |
| Common coefficient | (r) | (r_s) or (\rho) |
| Suitable data | Quantitative variables | Ordinal or rankable variables; also quantitative data |
| Relationship required | Approximately linear for a meaningful summary | Monotonic, not necessarily linear |
| Effect of extreme values | Can be strongly affected | Often less sensitive to extreme magnitudes |
| Tied values | Not a special issue for calculation | Handled using appropriate rank procedures |
| Interpretation | Direction and strength of linear association | Direction and strength of rank-based monotonic association |
| Common application | Height and weight | Class rank and satisfaction rating |
Neither method is universally superior. The correct choice depends on your data and the relationship you want to investigate.
Pearson vs. Spearman Correlation: Worked Example
Consider a researcher studying the relationship between study hours and examination scores. Five students provide the following observations.
| Student | Study hours (X) | Exam score (Y) |
|---|---|---|
| A | 1 | 50 |
| B | 2 | 55 |
| C | 3 | 65 |
| D | 4 | 70 |
| E | 5 | 80 |
Both variables increase together, and the ordering of students is identical for study hours and examination scores.
For these data:
- Pearson correlation is approximately 0.994.
- Spearman correlation is 1.000.
What Do These Results Mean?
The Pearson coefficient of approximately 0.994 indicates a very strong positive linear association between study hours and examination scores in this small dataset.
The Spearman coefficient of 1.000 indicates a perfect positive rank association: students are ordered identically by study hours and examination scores.
The coefficients differ because Pearson measures the numerical pattern of the observations, while Spearman measures their ranking.
However, this example does not establish that studying longer causes higher scores. Other factors, such as prior knowledge, study quality, and examination difficulty, may also influence performance.
Research takeaway: Two methods can produce different coefficients for the same dataset without either calculation being incorrect.
Example 2: When Spearman Correlation Is More Appropriate
Suppose a biologist investigates the relationship between the concentration of a treatment and a measure of biological response.
| Treatment concentration | Response measurement |
|---|---|
| 1 | 10 |
| 2 | 20 |
| 3 | 40 |
| 4 | 80 |
| 5 | 160 |
The response increases as concentration increases, but it does not increase at a constant rate. The pattern is curved rather than linear.
For these observations:
- Pearson correlation is approximately 0.966.
- Spearman correlation is 1.000.
The Spearman coefficient is perfect because the rank order of both variables is identical. Pearson correlation is also strongly positive, but it reflects the fact that the numerical relationship is nonlinear.
This example illustrates why Spearman correlation can be useful when a relationship consistently increases or decreases but does not follow a straight line.
In actual laboratory research, a more complex dose-response pattern may not be monotonic. For example, a response might increase at first and then decrease at higher concentrations. In that situation, neither Pearson nor Spearman correlation alone may adequately describe the relationship.
Example 3: Correlation With Ordinal Data
Imagine that a researcher asks participants to rate their satisfaction with a service on a five-point scale:
1 = Very dissatisfied
2 = Dissatisfied
3 = Neutral
4 = Satisfied
5 = Very satisfied
The researcher wants to investigate whether satisfaction ratings are associated with a participant’s ranked assessment of service quality.
Because the responses represent ordered categories, Spearman correlation may be an appropriate choice.
Pearson correlation treats numerical differences as meaningful and equally spaced. This may be reasonable for some constructed scores, but it should not automatically be assumed for individual ordinal ratings.
Spearman correlation focuses on the ordering of responses and is often easier to justify for ordinal measurements.
How to Choose Between Pearson and Spearman Correlation
Before calculating a correlation coefficient, examine your data and define your research question.
Step 1: Identify the measurement scale
Determine whether your variables are continuous numerical measurements, discrete quantitative observations, ordinal ratings, or another type of data.
Ordinal measurements often favor Spearman correlation, while quantitative measurements may support either method.
Step 2: Create a scatter plot
A scatter plot helps you see the direction, shape, and possible outliers in the relationship.
- A roughly straight-line pattern may support Pearson correlation.
- A consistently increasing or decreasing curved pattern may support Spearman correlation.
- A U-shaped or inverted U-shaped pattern may not be adequately summarized by either coefficient.
Step 3: Examine influential outliers
A small number of extreme observations can substantially change Pearson correlation. Spearman correlation is often less affected by extreme magnitudes, although unusual observations can still alter ranks.
Investigate outliers carefully rather than removing them automatically.
Step 4: Consider the assumptions
For Pearson correlation, assess linearity and influential outliers. Conventional inference also depends on the sampling design and assumptions underlying the chosen significance test.
For Spearman correlation, assess whether the relationship is monotonic and whether the observations can be meaningfully ranked.
Step 5: Match the method to your research question
If you want to quantify a linear association between two numerical variables, Pearson correlation may be suitable.
If you want to quantify a monotonic association based on ranks, or you are working with ordinal data, Spearman correlation may be more appropriate.
Do not choose a method solely because it produces a smaller p-value or a larger correlation coefficient.
How to Calculate Pearson and Spearman Correlation
You can calculate both coefficients using statistical software, spreadsheets, or an online calculator.
Using Excel
For paired numerical observations in cells A2:A11 and B2:B11, Pearson correlation can be calculated with:
=CORREL(A2:A11,B2:B11)
For Spearman correlation, first rank each variable separately using the RANK.AVG function. Then calculate the Pearson correlation between the two columns of ranks.
For example, if the ranks are in C2:C11 and D2:D11, use:
=CORREL(C2:C11,D2:D11)
This procedure handles tied ranks by assigning average ranks. Ensure that the paired observations are aligned correctly and that missing values are handled consistently.
Using Statistical Software
Packages such as SPSS, R, and Python can calculate Pearson and Spearman correlation coefficients and provide significance tests.
In SPSS, open Analyze → Correlate → Bivariate, select the variables, and choose Pearson or Spearman as appropriate.
Always inspect the data and the output rather than relying solely on the coefficient. Record the method, sample size, coefficient, and relevant p-value or confidence interval in your research report.
Using ResearchUtility’s Online Correlation Calculators
An online correlation calculator can help you analyze paired observations without performing the calculations manually.
- Use the Pearson Correlation Calculator when you want to measure the strength and direction of a linear relationship between two numerical variables.
- Use the Spearman Rank Correlation Calculator when you want to measure a monotonic association using ranked observations. The calculator supports tied ranks, reports a permutation-based p-value, estimates a 95% paired-bootstrap confidence interval, displays the rank calculation table, and allows you to export the results as CSV.
For reproducible research, verify how any calculator handles missing values, tied ranks, and significance testing. Keep the coefficient, sample size, test method, p-value, and uncertainty measures with your research records.
How to Interpret Correlation Coefficients
Both Pearson and Spearman coefficients range from −1 to +1.
| Coefficient | General interpretation |
|---|---|
| +1 | Perfect positive association |
| Close to +1 | Strong positive association |
| Around 0 | Little or no association of the type measured |
| Close to −1 | Strong negative association |
| −1 | Perfect negative association |
These descriptions are broad guidelines, not universal scientific thresholds. What counts as a weak, moderate, or strong correlation depends on the research field, measurement reliability, sample size, and study purpose.
A coefficient of 0.60 may be meaningful in one field but less informative in another.
It is also important to distinguish correlation strength from statistical significance. A small correlation can be statistically significant in a large sample, while a substantial correlation may be statistically uncertain in a small sample.
Finally, correlation does not establish causation. A relationship between two variables may be influenced by confounding variables, reverse causality, or the way the study was designed.
Common Mistakes to Avoid
1. Assuming Pearson correlation is always better.
Pearson is useful for linear relationships, but it may not adequately summarize a curved or non-monotonic pattern.
2. Assuming Spearman correlation works for every nonlinear relationship.
Spearman measures monotonic association. A U-shaped relationship can produce a coefficient near zero even when a clear relationship exists.
3. Treating correlation as proof of causation.
An association alone does not demonstrate that one variable causes another to change.
4. Ignoring outliers.
Extreme observations can affect correlation estimates. Investigate their validity and influence before deciding how to handle them.
5. Comparing coefficients without considering their meaning.
Pearson and Spearman measure different aspects of association. A larger coefficient does not automatically make one method preferable.
6. Reporting only the p-value.
Report the coefficient, sample size, and relevant uncertainty measures where appropriate. Explain what the association means in the context of your research question.
Frequently Asked Questions (FAQs)
1. What is the main difference between Pearson and Spearman correlation?
Pearson correlation measures the strength and direction of a linear relationship using original numerical values. Spearman correlation measures the strength and direction of a monotonic relationship using ranks.
2. Which is better, Pearson or Spearman correlation?
Neither method is universally better. Pearson is often suitable for linear relationships between quantitative variables. Spearman is often suitable for ordinal data or monotonic relationships that are not necessarily linear.
3. Can Spearman correlation be used for non-normal data?
Yes. Spearman correlation does not require normally distributed variables to calculate its coefficient. However, the assumptions of the particular significance test or confidence interval still need to be considered.
4. Can Pearson correlation be used for ordinal data?
It can be calculated on numerical codes, but doing so may not be appropriate if the distances between categories are not meaningfully equal. Spearman correlation is often a more defensible choice for ordinal measurements.
5. What does a Spearman correlation of 1 mean?
A Spearman coefficient of +1 indicates a perfect positive rank association. As one variable increases, the other follows the same rank ordering, including the appropriate treatment of tied values.
6. What does a Pearson correlation of zero mean?
A Pearson coefficient of zero indicates no linear association in the observed data. It does not rule out a nonlinear relationship.
7. Does correlation prove causation?
No. Correlation measures association, not causation. Establishing causality generally requires an appropriate study design and additional evidence.
8. Can I calculate Pearson and Spearman correlation in Excel?
Yes. Use CORREL for Pearson correlation. For Spearman correlation, rank both variables using RANK.AVG and then calculate the correlation between their ranks.
Conclusion
Pearson and Spearman correlation are both valuable tools for analyzing relationships between variables, but they answer slightly different questions.
Pearson correlation is generally appropriate when you want to measure a linear association between quantitative variables. Spearman correlation is often preferable when your variables are ordinal, when a monotonic relationship is nonlinear, or when a rank-based measure better matches your research question.
The most reliable approach is to understand your measurements, visualize the relationship, examine outliers, and choose the method that fits your study design.
For students, laboratory researchers, and data analysts, learning this distinction can improve statistical interpretation and help prevent misleading conclusions.
Ready to analyze your research data? Use an appropriate correlation calculator or statistical package to calculate the coefficient, then interpret it alongside your research question, sample size, and study design.
Related Resources
Continue your statistical analysis with these ResearchUtility resources:
- Pearson Correlation Calculator — calculate the linear association between two numerical variables.
- Spearman Rank Correlation Calculator — calculate Spearman’s rho, including average-rank handling for tied observations.
- Statistical Calculators — explore additional calculators for research and data analysis.
- Data Analysis Tools — explore tools for preparing, analyzing, and interpreting research datasets.