
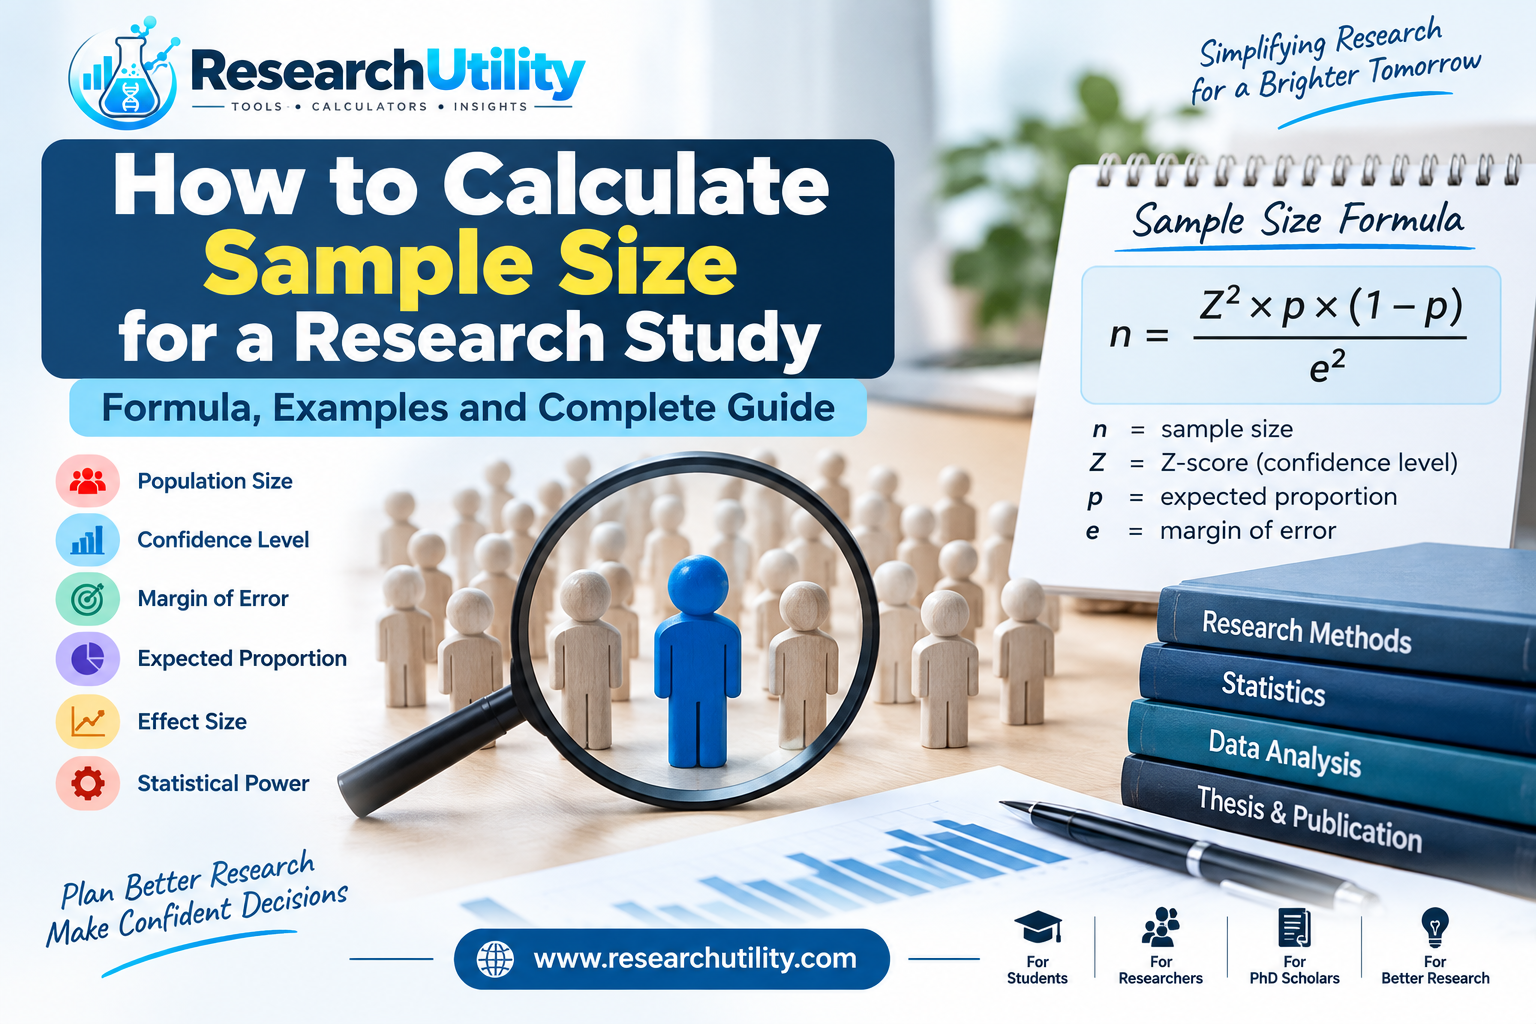
How to Calculate Sample Size for a Research Study: Formula, Examples and Complete Guide
Choosing an appropriate sample size is one of the most important steps in research design. Whether you are conducting a PhD study, clinical research, biological experiment, survey, epidemiological investigation, or academic project, the number of observations or participants included in a study can influence the reliability and usefulness of the results.
A sample that is too small may provide insufficient information to detect an effect or estimate a population parameter precisely. On the other hand, collecting an unnecessarily large sample can consume additional time, money, participants, laboratory resources, and other research resources.
This guide explains how to calculate sample size for a research study, the most important sample size parameters, commonly used formulas, worked examples, common mistakes, and how an online Sample Size Calculator can help with the mathematical part of the calculation.
Quick tool: Use the ResearchUtility Sample Size Calculator to perform sample-size calculations after determining the appropriate assumptions for your study.
What Is Sample Size?
Sample size is the number of observations, participants, experimental units, specimens, records, or other units included in a research study.
For example:
- A survey involving 400 people has a sample size of 400.
- An experiment involving 30 animals has a sample size of 30 animals.
- A laboratory experiment with 12 independent experimental units has a sample size of 12.
- A study analyzing 250 patient records has a sample size of 250 records.
Sample size is usually represented by n in statistical formulas.
The correct sample size depends on the research question, study design, outcome variable, expected effect, variability, desired precision, confidence level, statistical power, and other assumptions.
Therefore, there is no single sample size that is appropriate for every research study.
Why Is Sample Size Important in Research?
Sample size affects several important aspects of a study.
1. Precision of estimates
A larger sample generally provides more information about the population and can improve the precision of estimates, assuming the observations provide relevant independent information.
For example, estimating the average blood pressure from 20 participants generally provides less information than estimating it from a well-designed sample of 200 participants.
2. Statistical power
For hypothesis-testing studies, sample size is closely related to statistical power.
Statistical power is the probability of detecting an effect of a specified size when that effect truly exists under the assumptions of the planned analysis.
A study with insufficient power may fail to detect an important effect.
3. Research resources
Increasing sample size can require:
- More participants
- More laboratory materials
- More experimental animals or specimens
- More staff time
- More data collection
- More analysis time
- Higher financial costs
The goal is therefore not simply to maximize sample size.
The goal is to select a sample size that is scientifically justified for the study design and research question.
What Factors Determine Sample Size?
Several parameters can influence sample-size calculations.
1. Population size
Population size refers to the total population from which the sample is drawn.
For example, if a university has 10,000 eligible students and you want to conduct a survey among them, the population size is 10,000.
However, population size does not always need to be entered into every sample-size calculation. The appropriate formula depends on the study design and sampling framework.
2. Confidence level
Confidence level represents the desired confidence associated with an interval estimate under the statistical procedure being used.
Common choices include:
- 90%
- 95%
- 99%
A 95% confidence level is frequently used in research, but it is not automatically appropriate for every study.
Increasing the confidence level generally increases the required sample size when other parameters remain constant.
3. Margin of error
Margin of error describes the desired maximum amount of sampling error around an estimated population proportion or parameter under the assumptions of the selected calculation.
Common choices include:
- 10%
- 5%
- 3%
- 2%
A smaller margin of error requires greater precision and generally requires a larger sample.
For example, a study designed to estimate a proportion with a 2% margin of error will generally require more observations than one designed for a 5% margin of error.
4. Expected proportion
For studies estimating a population proportion, an expected proportion may be required.
If there is no reliable prior estimate of the proportion, researchers sometimes use 50% because it produces the largest variance for a binary proportion and therefore gives a conservative sample-size requirement under the basic proportion formula.
However, the expected proportion should be selected thoughtfully when reliable previous evidence is available.
5. Expected effect size
For hypothesis-testing studies, the expected effect size is often a major component of sample-size planning.
Effect size describes the magnitude of the difference, association, or relationship that the study aims to detect.
For example, researchers may want to detect:
- A difference between two means
- A difference between two proportions
- A correlation
- A treatment effect
- A change from baseline
- An association between variables
Smaller effects generally require larger samples to detect reliably, all else being equal.
6. Statistical power
Statistical power is particularly important when the objective is to test a hypothesis.
Common target values include:
- 80%
- 90%
- 95%
A higher desired power generally requires a larger sample size, assuming other parameters remain constant.
Power calculations should be based on the statistical test and study design that will actually be used.
Basic Sample Size Formula for a Population Proportion
One commonly used formula for estimating a population proportion is:
n₀ = Z² × p × (1 − p) / e²
Where:
- n₀ = initial estimated sample size
- Z = Z-score corresponding to the selected confidence level
- p = expected population proportion
- e = desired margin of error
For a 95% confidence level, the commonly used Z value is approximately:
Z = 1.96
If no prior estimate of the proportion is available, researchers may use:
p = 0.50
for a conservative calculation.
Sample Size Example
Suppose you want to estimate a population proportion with:
- Confidence level = 95%
- Expected proportion = 50%
- Margin of error = 5%
The values are:
Z = 1.96
p = 0.50
e = 0.05
The formula becomes:
n₀ = (1.96² × 0.50 × 0.50) / 0.05²
First:
1.96² = 3.8416
Then:
0.50 × 0.50 = 0.25
Therefore:
n₀ = (3.8416 × 0.25) / 0.0025
n₀ = 0.9604 / 0.0025
n₀ = 384.16
The initial sample size is therefore approximately:
385 participants
The final required sample may need additional adjustment depending on the population size, sampling design, expected nonresponse, or other study-specific considerations.
How to Calculate Sample Size When Population Size Is Finite
When the target population is relatively small, a finite population correction may be appropriate under the relevant sampling assumptions.
A commonly used adjusted formula is:
n = n₀ / [1 + (n₀ − 1) / N]
Where:
- n = adjusted sample size
- n₀ = initial sample size
- N = population size
For example, suppose:
n₀ = 385
and:
N = 1,000
Then:
n = 385 / [1 + (384 / 1,000)]
n = 385 / 1.384
Approximately:
n ≈ 278
This illustrates why population size can matter when sampling from a finite population.
However, researchers should not automatically apply a finite-population correction simply because a population size is known. Its use depends on the sampling framework and assumptions.
Sample Size for Experimental Research
Sample-size planning for experimental studies is different from simply estimating a population proportion.
For example, suppose you want to compare:
- Control vs treatment
- Drug A vs Drug B
- Before vs after measurements
- Two independent groups
- Multiple experimental groups
The required sample size may depend on:
- Expected effect size
- Standard deviation or variance
- Significance level
- Statistical power
- Number of groups
- Allocation ratio
- Paired or independent observations
- Statistical test
- One-sided or two-sided hypothesis
Therefore, a simple survey sample-size formula should not automatically be used for an experimental study.
For experimental research, researchers should calculate sample size based on the statistical analysis planned for the primary outcome.
Sample Size and Statistical Power
One of the most important concepts in experimental sample-size planning is power analysis.
Suppose you want to compare two independent groups.
Your calculation may require:
- Expected difference between groups
- Standard deviation
- Alpha level
- Desired power
- Allocation ratio
For example, if you expect only a small difference between groups, detecting that difference reliably generally requires a larger sample than detecting a very large difference.
This is one reason why statements such as:
“A sample size of 30 is always enough for research”
are scientifically inappropriate.
There is no universal minimum sample size that applies to every research design.
Sample Size for a PhD Thesis
Sample-size justification is particularly important when preparing a PhD research proposal, dissertation, or thesis.
A thesis may involve several types of data, including:
- Experimental measurements
- Biological observations
- Animal studies
- Clinical observations
- Surveys
- Epidemiological data
- Laboratory measurements
- Molecular data
- Environmental measurements
The appropriate sample-size method depends on the research question and study design.
For example, the sample size for a questionnaire-based prevalence study may be calculated differently from the sample size for a laboratory experiment comparing two treatment groups.
When writing your thesis, do not simply state:
“The sample size was selected as 30.”
Instead, provide a methodological justification.
A sample-size section should explain the assumptions and method used to determine the required number of observations.
Sample Size for Biological and Laboratory Experiments
Biological research often requires special attention to the definition of an experimental unit.
For example, consider an animal experiment with:
- Control group
- Low-dose group
- Medium-dose group
- High-dose group
If each group contains 10 animals, the total number of animals is 40.
However, simply stating “n = 40” may not be sufficient.
Researchers need to clearly distinguish:
- Biological replicates
- Technical replicates
- Experimental units
- Repeated measurements
- Pseudoreplication
For example, measuring the same biological sample five times does not necessarily mean that you have five independent biological observations.
The appropriate unit of replication should be determined from the study design.
Sample Size vs Number of Measurements
This distinction is extremely important in scientific research.
Suppose a researcher measures blood glucose three times for each animal.
If there are:
10 animals × 3 measurements
there are 30 measurements, but there are not necessarily 30 independent experimental units.
Depending on the study design, the animal may be the experimental unit while the repeated measurements represent technical or longitudinal observations.
Therefore:
Number of measurements ≠ automatically the effective sample size.
Researchers should determine the correct experimental unit before performing statistical analysis or sample-size calculations.
Sample Size and Nonresponse
Survey studies often experience nonresponse.
Suppose your calculated required sample is:
400 participants
but you expect only 80% of invited participants to provide usable responses.
The number you need to invite may therefore be larger than 400.
A simple adjustment is:
Required invitations = Required completed responses / Expected response rate
For an 80% expected response rate:
400 / 0.80 = 500
Therefore, approximately 500 participants may need to be approached to obtain around 400 usable responses, assuming the response-rate assumption is realistic.
Nonresponse adjustment should be considered during study planning rather than after data collection has already finished.
What Is the Difference Between Sample Size and Sampling Method?
Sample size tells you how many observations are required.
Sampling method describes how those observations are selected.
Common sampling methods include:
- Simple random sampling
- Systematic sampling
- Stratified sampling
- Cluster sampling
- Convenience sampling
- Purposive sampling
A statistically calculated sample size does not automatically make a study representative.
For example, surveying 1,000 people through a highly biased convenience sample does not necessarily produce a representative estimate simply because the number 1,000 is large.
Sample size and sampling methodology must therefore be considered together.
How to Use a Sample Size Calculator
An online sample size calculator can simplify the mathematical part of sample-size estimation.
ResearchUtility provides a dedicated collection of research and data tools, including a Sample Size Calculator.
A practical workflow is:
Step 1: Define your research question
Clearly identify what you want to estimate, compare, or detect.
Step 2: Identify the primary outcome
Determine the main variable or outcome that will drive the sample-size calculation.
Step 3: Identify the study design
Determine whether your study is:
- Survey-based
- Observational
- Experimental
- Clinical
- Epidemiological
- Laboratory-based
- Comparative
- Correlational
Step 4: Select the appropriate statistical method
The calculation should correspond to the planned analysis.
Step 5: Determine the required assumptions
Depending on the method, you may need:
- Confidence level
- Margin of error
- Expected proportion
- Effect size
- Standard deviation
- Statistical power
- Significance level
- Population size
Step 6: Calculate the required sample size
Use an appropriate statistical method or sample-size calculator.
Step 7: Consider attrition or nonresponse
If participants may withdraw or fail to provide usable data, consider an appropriate adjustment.
Step 8: Document the calculation
Keep a record of the assumptions and method so the sample-size justification can be reported transparently in the protocol, thesis, dissertation, or manuscript.
Sample Size Calculator: What It Can and Cannot Do
A calculator can perform mathematical calculations quickly and reduce arithmetic errors.
However, it cannot determine the correct study design for you.
For example, entering arbitrary values into a sample-size calculator does not automatically produce a scientifically valid sample size.
The researcher must determine:
- What outcome matters?
- What study design is being used?
- What statistical test will be performed?
- What effect is scientifically meaningful?
- What level of uncertainty is acceptable?
- What assumptions are supported by previous research?
The calculator then helps perform the mathematical calculation based on those assumptions.
This distinction is important because sample-size calculation is a statistical planning problem, not simply an arithmetic problem.
Common Sample Size Calculation Mistakes
Mistake 1: Using the same sample size for every study
There is no universal sample size.
A survey, randomized experiment, animal study, correlation study, and prevalence study can require very different sample-size approaches.
Mistake 2: Choosing sample size only because another paper used it
A previous study can provide useful information about variability, prevalence, or effect size.
However, copying its sample size without considering differences in study design and research question may not be justified.
Mistake 3: Ignoring statistical power
For hypothesis-testing studies, sample size should generally be connected to the desired power and effect size.
Mistake 4: Using the wrong effect size
An unrealistic expected effect can produce an unrealistic sample-size requirement.
Effect-size assumptions should ideally be supported by:
- Previous studies
- Pilot data
- Meta-analysis
- Established scientific knowledge
- A minimally important difference
Mistake 5: Confusing technical replicates with independent samples
Multiple measurements from the same biological unit are not automatically independent observations.
This can lead to pseudoreplication and inappropriate statistical conclusions.
Mistake 6: Forgetting nonresponse or attrition
If you require 300 completed responses but expect only 75% of invited participants to provide usable data, you cannot simply invite 300 people and assume you will obtain 300 observations.
Mistake 7: Reporting only the final number
A thesis or research paper should ideally explain how the sample size was determined.
For example:
“The required sample size was calculated using an a priori sample-size analysis based on an expected effect size of X, significance level of Y, statistical power of Z, and the planned statistical test.”
The exact wording should reflect the actual method used.
How to Report Sample Size Calculation in a Research Paper
A sample-size justification should normally identify the method and important assumptions.
For example:
“The required sample size was determined a priori based on an anticipated effect size, a two-sided significance level of 0.05, and 80% statistical power.”
For a proportion-based study, the report might instead describe:
- Expected prevalence/proportion
- Confidence level
- Desired precision
- Population size, where applicable
- Allowance for nonresponse
The exact reporting format should follow the study design and target journal’s requirements.
Does a Larger Sample Always Mean Better Research?
Not necessarily.
A large sample does not compensate for:
- Poor sampling
- Measurement error
- Biased recruitment
- Poor experimental design
- Incorrect statistical analysis
- Confounding
- Pseudoreplication
- Poor data quality
A scientifically appropriate sample size is only one part of a good research design.
Researchers should aim for a sample that is sufficiently informative for the research question while remaining scientifically, ethically, and practically justified.
Sample Size and Ethics
In studies involving human participants or animals, sample-size planning can also have ethical implications.
A sample that is too small may expose participants or experimental subjects to research procedures without producing sufficiently informative results.
Conversely, unnecessarily large samples may expose more participants or animals to research procedures than scientifically necessary.
Therefore, sample-size justification should be considered as part of responsible research planning.
Frequently Asked Questions About Sample Size Calculation
What is sample size in research?
Sample size is the number of observations, participants, experimental units, specimens, or records included in a study.
What is the most common sample size formula?
There is no single formula suitable for every study. A commonly used formula for estimating a population proportion is:
n₀ = Z²p(1 − p) / e²
However, experimental and hypothesis-testing studies often require different calculations.
What sample size is sufficient for a research study?
There is no universal minimum sample size. The required number depends on the research design, outcome, expected effect, variability, precision, statistical power, significance level, and other assumptions.
Is 30 a sufficient sample size?
Not necessarily. Although 30 is sometimes used as a rule of thumb in certain contexts, it should not be treated as a universal requirement or guarantee of valid statistical inference.
What sample size is needed for a PhD thesis?
There is no standard sample size for a PhD thesis. The appropriate sample size should be justified according to the research question, study design, statistical analysis, expected effect or precision, and relevant scientific or ethical considerations.
What confidence level should I use?
A 95% confidence level is common, but the appropriate confidence level depends on the study and research objectives.
Does increasing sample size increase statistical power?
Generally, yes, when other assumptions remain constant. A larger sample usually provides more information and can increase the ability to detect a specified effect.
Does sample size affect confidence intervals?
Yes. Larger samples generally produce smaller standard errors and can result in narrower confidence intervals when other conditions remain comparable.
Can I use a sample-size calculator for an experimental study?
Yes, provided the calculator uses a method appropriate for your experimental design and statistical analysis. A generic proportion formula should not automatically be used for an experimental comparison.
Should I increase the calculated sample size for dropout?
Often, yes. If participant dropout, missing data, or nonresponse is expected, the recruitment target may need to be increased so that the final analyzable sample remains adequate.
Final Takeaway
Sample-size calculation is an important part of research planning.
The correct sample size depends on much more than a simple rule such as “use 30 participants” or “use 10 participants per group.”
Researchers should consider:
- Research question
- Study design
- Primary outcome
- Population
- Sampling method
- Expected effect size
- Variability
- Confidence level
- Margin of error
- Statistical power
- Significance level
- Expected nonresponse or attrition
- Experimental unit
- Planned statistical analysis
Once these assumptions have been established, a sample-size calculator can make the mathematical calculation faster and easier to verify.
Calculate your sample size with ResearchUtility
Use the ResearchUtility Sample Size Calculator as part of your research-planning workflow:
You can also explore other ResearchUtility resources for confidence intervals, statistical calculations, laboratory calculations, and data analysis. The platform currently organizes tools across research, statistics, laboratory work, biology, and data analysis.
Remember that an online calculator is a mathematical aid. The scientific validity of a sample-size calculation depends on choosing assumptions and a method that are appropriate for your resea


