Standard Error vs. Standard Deviation: Differences and Examples
Standard Error vs. Standard Deviation: Differences and Examples
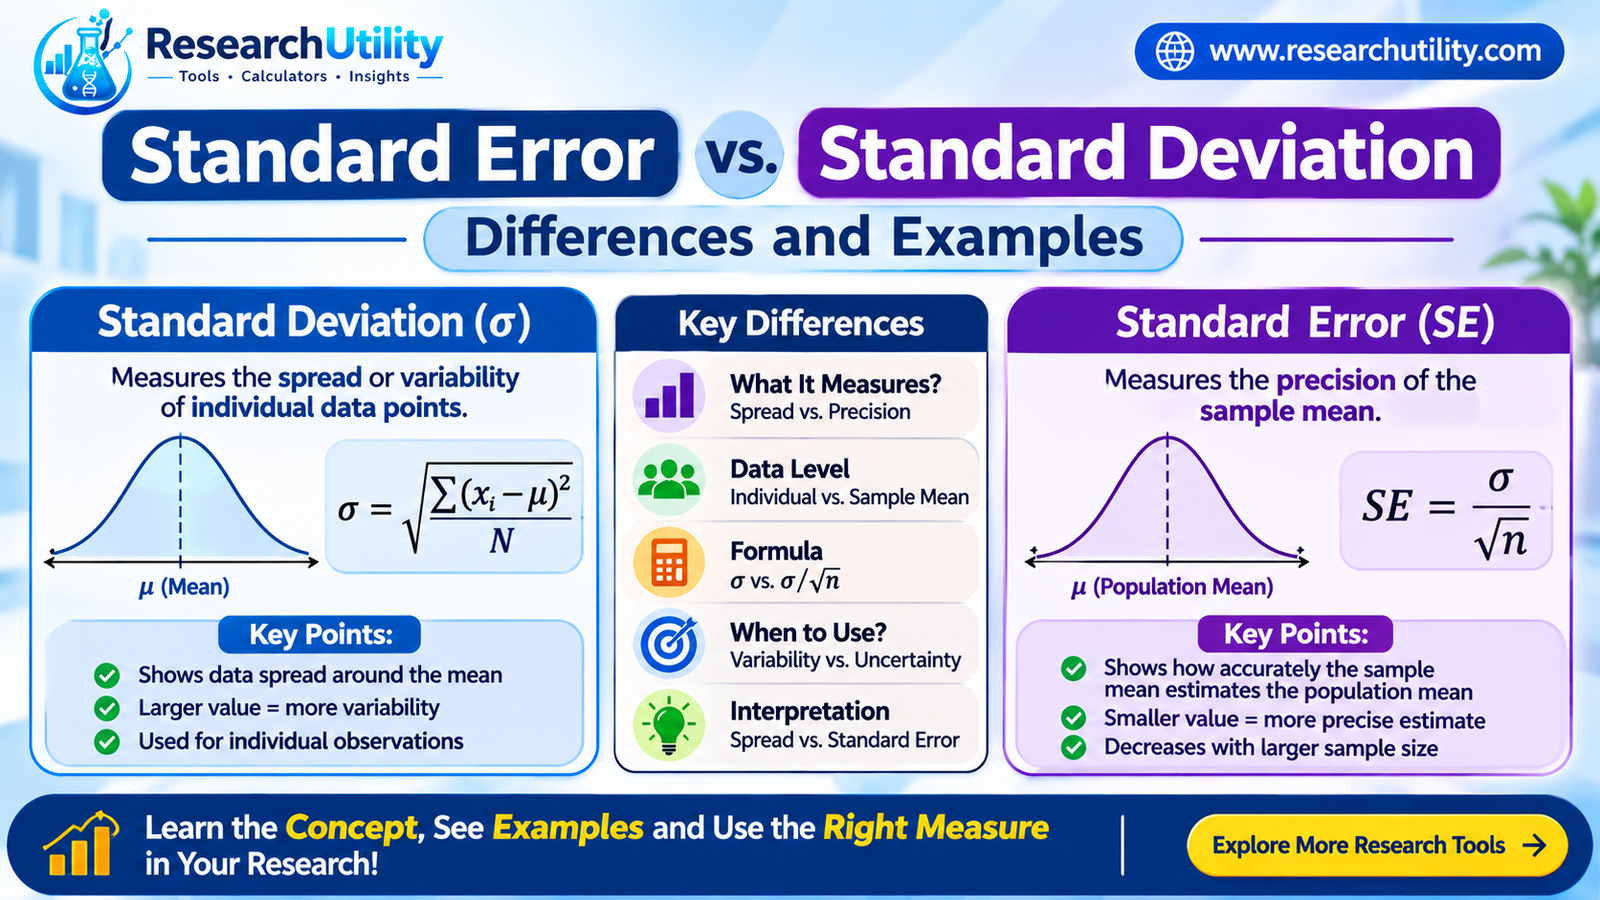
Standard error vs standard deviation is one of the most common points of confusion in statistics, and one of the most common mistakes in published research. Both describe variability, and both appear as a “±” value next to a mean, so it is easy to treat them as interchangeable. They are not. Standard deviation describes how spread out your data are. Standard error describes how precisely your sample mean estimates the true population mean.
Short answer
Standard deviation (SD) measures the spread of individual observations around the mean. Standard error (SE) measures how far the sample mean is likely to be from the true population mean. SD does not shrink as you collect more data, but SE does, because SE = SD ÷ √n.
What is standard deviation?
Standard deviation (σ for a population, s for a sample) tells you how far individual data points typically fall from the mean. A small SD means the values cluster tightly around the mean. A large SD means they are widely scattered.
For an entire population, the formula is:
σ = √[ Σ(xᵢ − μ)² ÷ N ]
where xᵢ is each observation, μ is the population mean and N is the number of observations. In practice you usually have a sample, not the whole population, so you divide by n − 1 instead of N:
s = √[ Σ(xᵢ − x̄)² ÷ (n − 1) ]
The n − 1 correction (Bessel’s correction) prevents the sample SD from underestimating the true spread of the population.
How to interpret it. If your data are roughly normally distributed, about 68% of values fall within 1 SD of the mean, about 95% within 2 SD, and about 99.7% within 3 SD. SD is in the same units as your data, which makes it easy to read.
Want to check your own numbers? Use our free Standard Deviation Calculator.
What is standard error?
Standard error (most often the standard error of the mean, or SEM) measures how much your sample mean would vary if you repeated the study many times with new random samples from the same population. In other words, it is the standard deviation of the sampling distribution of the mean.
The formula is:
SE = σ ÷ √n (estimated in practice as s ÷ √n)
Because the true population SD (σ) is rarely known, researchers substitute the sample SD (s). The result tells you how precisely your sample mean estimates the population mean. A smaller SE means a more precise estimate.
The key idea is the √n in the denominator. Averaging many observations cancels out random noise, so larger samples give more stable means. To cut the standard error in half, you need four times as many observations.
Standard errors exist for other statistics too, such as proportions, regression coefficients and differences between means, but the SEM is the one people usually compare with SD. You can compute it with our Standard Error Calculator.
Standard error vs standard deviation: key differences
| Feature | Standard deviation (SD) | Standard error (SE) |
|---|---|---|
| What it measures | Spread (variability) of individual data points | Precision of the sample mean |
| Level | Individual observations | Sample mean |
| Formula | σ = √[Σ(xᵢ − μ)² ÷ N] | SE = σ ÷ √n (or s ÷ √n) |
| Effect of larger sample | Stays about the same (just becomes a more stable estimate) | Decreases |
| Size | Larger | Always smaller than SD when n > 1 |
| Answers the question | “How variable are my data?” | “How uncertain is my estimate of the mean?” |
| Typical use | Describing a sample | Inference: confidence intervals and hypothesis tests |
Worked example with real numbers
Suppose you take five replicate measurements: 4, 8, 6, 5, 7.
- Mean: (4 + 8 + 6 + 5 + 7) ÷ 5 = 30 ÷ 5 = 6
- Deviations from the mean: −2, 2, 0, −1, 1
- Squared deviations: 4, 4, 0, 1, 1, which sum to 10
- Sample variance: 10 ÷ (5 − 1) = 2.5
- Sample SD: √2.5 = 1.58
- Standard error: 1.58 ÷ √5 = 1.58 ÷ 2.236 = 0.71
So you would describe the data as 6.0 ± 1.58 (mean ± SD), which tells readers how much individual values vary. The same sample gives 6.0 ± 0.71 (mean ± SE), which tells them how precisely the mean is estimated.
With 4 degrees of freedom, the critical t value for 95% confidence is 2.776, so the 95% confidence interval is 6 ± (2.776 × 0.71), or roughly 4.04 to 7.96.
How sample size changes SD and SE
This is where the two measures behave most differently. Assume the sample SD stays at 1.58 while the sample grows:
| Sample size (n) | SD | SE = SD ÷ √n |
|---|---|---|
| 5 | 1.58 | 0.71 |
| 20 | 1.58 | 0.35 |
| 100 | 1.58 | 0.16 |
| 400 | 1.58 | 0.08 |
The spread of the underlying population does not change just because you measured more individuals, so SD stays put. Your estimate of the mean keeps getting better, so SE keeps falling. Notice that going from 100 to 400 observations (four times as many) halves the SE.
When to use standard deviation vs standard error
Use standard deviation when you want to:
- Describe the variability of your sample or population
- Show how much individual observations differ from each other
- Report baseline characteristics in a “Participants” or “Materials and methods” table
- Check whether data are consistent, or spot unusually wide spread
Use standard error (or, better, a confidence interval) when you want to:
- Show how precisely your sample mean estimates the population mean
- Build confidence intervals around a mean
- Compare group means in a t-test, ANOVA or regression
- Plan sample sizes, since SE tells you how much precision extra data will buy
Common mistakes to avoid
- Using SE to describe variability. SE is smaller than SD, so it can make data look tighter than they really are. If your aim is to describe the spread of your data, report SD.
- Not saying which one you used. “6.0 ± 0.71” is meaningless unless the reader knows whether 0.71 is an SD, SE or confidence interval half-width. Always label it.
- Misreading error bars. SD bars show the spread of the data. SE bars show uncertainty in the mean. They are not interchangeable, and the figure legend must state which is plotted.
- Dividing by the wrong denominator. Use n − 1 for a sample SD and N only when you truly have the whole population.
How to report them in your research
- Describe your data with mean ± SD (n = 5).
- Express uncertainty about the mean with a 95% confidence interval, for example “mean = 6.0, 95% CI [4.04, 7.96]”. Many journals prefer this to ± SE.
- State in every table and figure legend what the “±” or the error bars represent.
- Check the target journal’s author guidelines, because some specify SD or SE for certain contexts.
Free calculators
Skip the manual arithmetic and calculate both in seconds:
- Standard Deviation Calculator: get the sample and population SD, variance and mean from your data.
- Standard Error Calculator: get the standard error of the mean from your SD and sample size.
Frequently asked questions
What is the difference between standard error and standard deviation in simple terms?
Standard deviation tells you how spread out the individual values in your data are. Standard error tells you how reliable your sample mean is as an estimate of the true population mean.
Is standard error always smaller than standard deviation?
Yes, whenever the sample size is greater than 1. Because SE = SD ÷ √n, dividing by a number larger than 1 always makes SE smaller than SD.
Should I report SD or SE in a research paper?
Report SD to describe the variability of your data. Report SE, or preferably a 95% confidence interval, to show the precision of an estimated mean. Always state which one you are using and follow your target journal’s guidelines.
Why does standard error decrease as sample size increases?
Because SE = SD ÷ √n. A larger sample averages out random variation, so the sample mean lands closer to the population mean. The relationship is a square root, so you need four times the data to halve the SE.
Is SEM the same as standard error?
SEM stands for standard error of the mean, which is the most common type of standard error. Other statistics, such as proportions and regression coefficients, have their own standard errors.
Does a large standard deviation mean my data are bad?
Not necessarily. A large SD means your measurements vary a lot, which can reflect genuine biological or experimental variability. It only becomes a concern if the variation comes from measurement error or inconsistent methods.
Conclusion
Standard deviation and standard error answer two different questions. SD describes your data; SE describes your estimate. Use SD to show how much individual observations vary, use SE or confidence intervals to show how precisely you have estimated the mean, and always label which one you are reporting. Ready to try it on your own dataset? Open the Standard Deviation Calculator and the Standard Error Calculator, or browse more free research tools on ResearchUtility.
References
- Altman DG, Bland JM. Standard deviations and standard errors. BMJ. 2005;331(7521):903.
- Barde MP, Barde PJ. What to use to express the variability of data: standard deviation or standard error of mean? Perspectives in Clinical Research. 2012;3(3):113–116.