
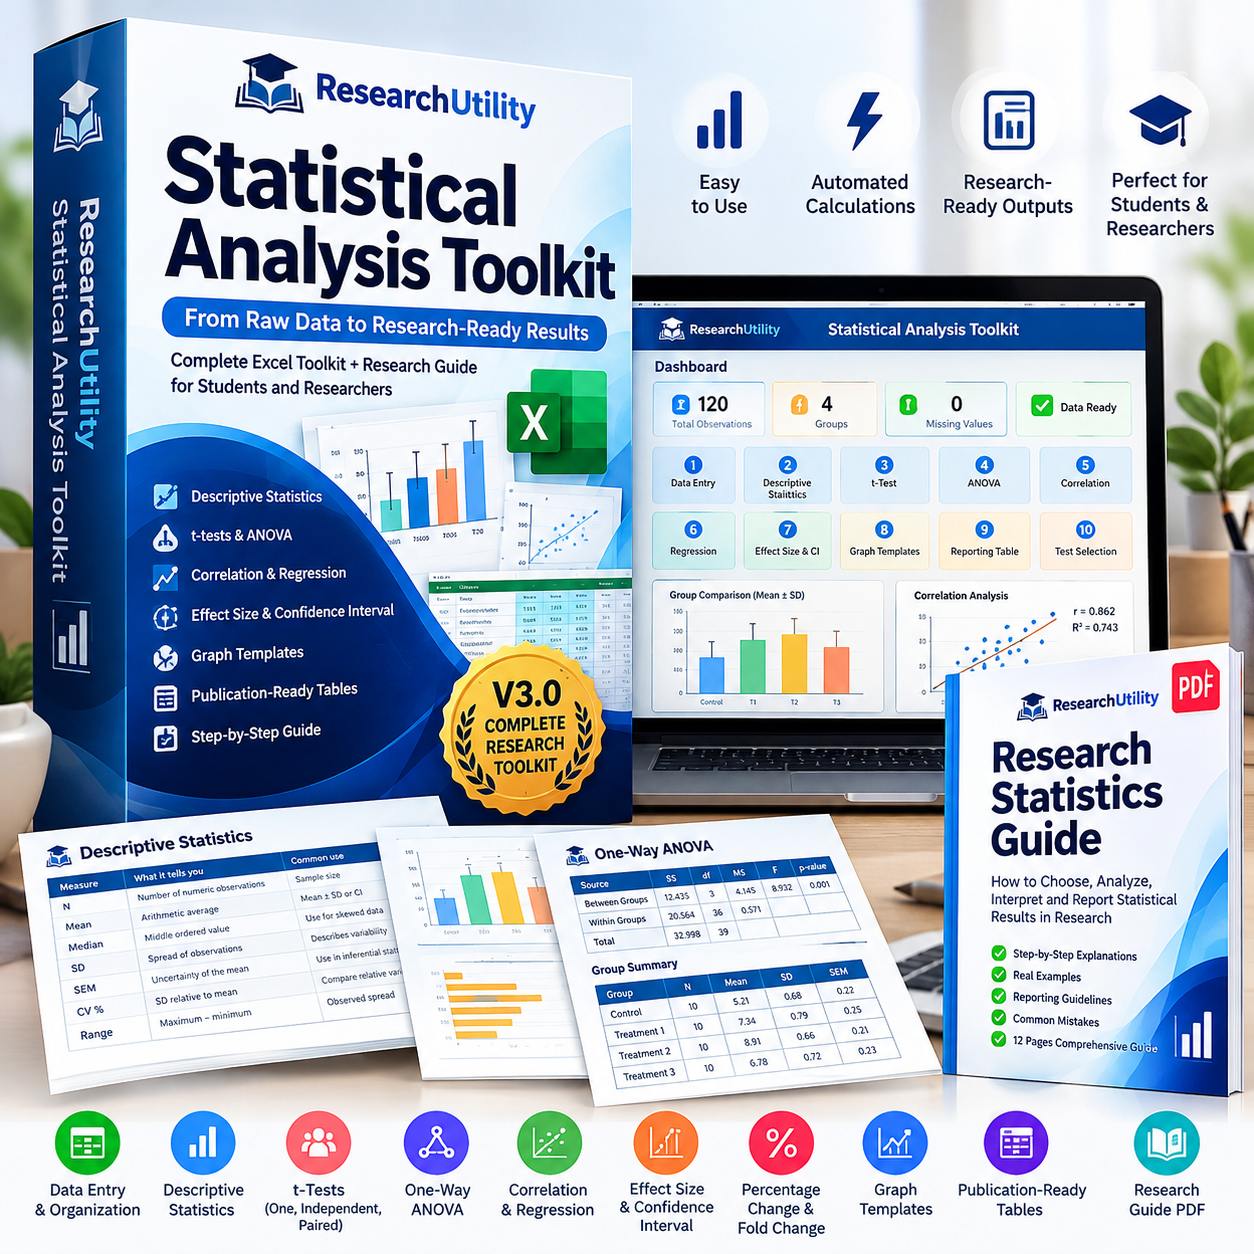
ResearchUtility Statistical Analysis Toolkit – Excel Statistics Tool & Research Guide
Original price was: ₹999.00.₹699.00Current price is: ₹699.00.
From Raw Data to Research-Ready Results.
A practical statistical analysis toolkit for students, PhD scholars, and researchers. Analyze your data with guided Excel tools for descriptive statistics, t-tests, ANOVA, correlation, regression, effect size, confidence intervals, graphs, reporting tables, and statistical test selection—plus a step-by-step Research Statistics Guide.
Description
ResearchUtility Statistical Analysis Toolkit V3.0
From Raw Data to Research-Ready Results
Struggling to decide which statistical test to use, how to analyze your data, or how to present your results clearly?
The ResearchUtility Statistical Analysis Toolkit V3.0 is a practical Excel-based statistical analysis resource designed to help students, PhD scholars, research scholars, and researchers move from raw experimental data to organized, interpretable, and research-ready results.
Instead of starting from a complicated statistical software interface, the toolkit provides a structured workflow that guides you through the major stages of statistical analysis.
📊 What You Get
Your purchase includes:
1. Statistical Analysis Excel Toolkit V3.0
A structured Excel workbook containing tools for:
- Descriptive Statistics
- Mean, SD and SEM
- t-Test analysis
- One-way ANOVA
- Pearson Correlation
- Simple Linear Regression
- Percentage Change
- Percentage Inhibition
- Fold Change
- Confidence Intervals
- Effect Size
- Statistical Test Selection
- Assumptions Checklist
- Reporting Sentence Builder
- Research Reporting Tables
- Graph Templates
- Example/Fictional Dataset
- Guided analysis workflow
📘 2. Research Statistics Guide PDF
A companion guide designed to help you understand the statistical concepts behind your analysis.
It covers practical topics such as:
- Choosing an appropriate statistical test
- Understanding descriptive statistics
- Interpreting t-tests
- Understanding ANOVA
- Correlation and regression
- Effect size
- Confidence intervals
- Statistical assumptions
- Presenting statistical results
- Writing research-ready statistical statements
🔬 A Simple Research Workflow
The toolkit follows a straightforward workflow:
DATA → DESCRIPTIVES → TEST → VERIFY → REPORT
Step 1 — Enter Your Data
Organize your experimental or observational data in the workbook.
Step 2 — Explore Your Data
Use descriptive statistics to understand your dataset before performing inferential analysis.
Step 3 — Select the Statistical Test
Use the Test Selection Guide to help identify an appropriate statistical approach based on your research question and data structure.
Step 4 — Verify Assumptions
Use the assumptions checklist to consider important requirements before interpreting statistical results.
Step 5 — Report Your Results
Use the reporting tools, tables, graph templates, and sentence builder to help organize your findings for research writing.
📈 Statistical Tools Included
Descriptive Statistics
Summarize your dataset using commonly used descriptive measures such as:
- Mean
- Standard deviation
- Standard error
- Sample size
- Group summaries
t-Test
Useful for comparing two groups where an appropriate t-test is justified by the study design and assumptions.
One-Way ANOVA
Analyze differences among multiple groups and organize your results for further interpretation.
Pearson Correlation
Examine the linear association between two quantitative variables.
Simple Linear Regression
Explore the relationship between a predictor and response variable and organize regression-related results.
Percentage & Fold-Change Analysis
Useful for research situations involving:
- Percentage change
- Percentage inhibition
- Fold change
Confidence Interval & Effect Size
Go beyond statistical significance by examining:
- Confidence intervals
- Effect size
- Magnitude of observed differences
🧪 Designed for Research Work
The toolkit is particularly useful for researchers working with experimental and observational datasets in areas such as:
- Zoology
- Biology
- Life Sciences
- Biotechnology
- Environmental Science
- Agriculture
- Microbiology
- Biochemistry
- Biomedical research
- Psychology
- Education
- Other quantitative research fields
📊 Research-Ready Reporting Resources
The toolkit doesn’t stop at calculations.
It also includes resources designed to help you organize your statistical findings for research writing:
Reporting Sentence Builder
Create structured statistical result statements using your calculated values.
Reporting Tables
Organize statistical outputs in a clearer research-oriented format.
Graph Templates
Use ready-made templates as a starting point for presenting your research data visually.
🎓 Who Is This Toolkit For?
PhD Scholars
Useful for organizing statistical analysis during thesis research, experiments, and manuscript preparation.
Research Scholars
Helpful when analyzing experimental datasets and preparing research reports.
Master’s & Undergraduate Students
A practical resource for understanding commonly used statistical procedures.
Biology & Life-Science Researchers
Especially useful for researchers working with group comparisons, biological measurements, correlations, and experimental datasets.
Beginners in Research Statistics
The guided workflow and accompanying guide make it easier to understand the overall analysis process.
⭐ Why Use ResearchUtility Statistical Analysis Toolkit V3.0?
✔ Excel-based workflow
Work within a familiar spreadsheet environment.
✔ Research-focused
Designed around common statistical tasks encountered during academic research.
✔ Guided analysis process
Follow a structured Data → Descriptives → Test → Verify → Report workflow.
✔ Multiple statistical methods
Access several commonly used statistical procedures in one workbook.
✔ Reporting resources included
Organize your statistical findings for research writing.
✔ Example data included
Learn the workflow using a fictional dataset before applying it to your own research data.
✔ Companion statistics guide
Understand the concepts behind the calculations rather than simply obtaining numbers.
📦 What You Receive
Your download package contains:
📊 ResearchUtility Statistical Analysis Toolkit V3.0 – Excel Workbook
📘 ResearchUtility Research Statistics Guide – PDF
📄 README / Getting Started Instructions
📦 Complete Digital Download Package
💻 Requirements
The toolkit is designed to be used with Microsoft Excel or a compatible spreadsheet application.
No additional statistical software is required for the core Excel-based workflow.
Important: Statistical software and spreadsheet tools can perform calculations, but researchers should still evaluate study design, assumptions, data quality, and the suitability of a statistical method before drawing scientific conclusions.
🚀 Start Your Statistical Analysis
Turn your raw research data into a more organized statistical workflow with the ResearchUtility Statistical Analysis Toolkit V3.0.
Analyze. Verify. Understand. Report.
ResearchUtility Statistical Analysis Toolkit V3.0
From Raw Data to Research-Ready Results.
Reviews
There are no reviews yet.